

Central Limit Theorem Without Complex Equations
The Central Limit Theorem is one of the most important ideas in statistics and data science. While the name may sound intimidating, the concept itself is surprisingly simple when explained with practical thinking instead of heavy formulas. This theorem helps analysts and researchers understand patterns in data, even when the original information looks random or inconsistent.
In simple terms, the Central Limit Theorem explains how averages from repeated samples tend to form a predictable pattern. This concept is widely used in business analytics, machine learning, market research, and scientific studies. If you want to build a strong understanding of statistics and practical analytics skills, consider enrolling in a Data Science Course in Mumbai at FITA Academy to gain hands on experience with real world datasets.
Understanding the Main Idea
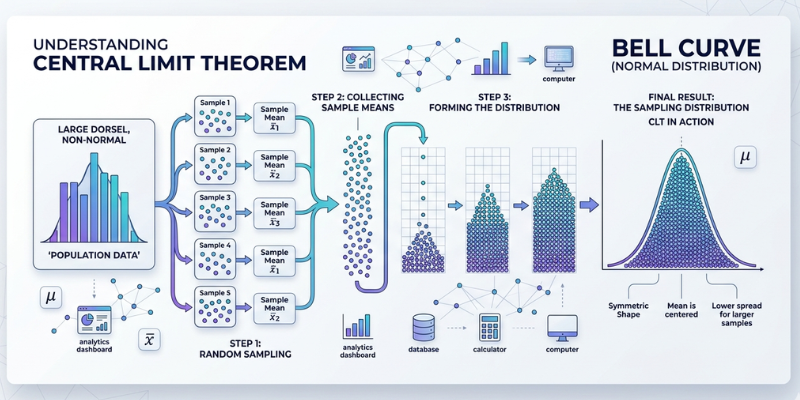
Imagine collecting the heights of a few students from different classrooms. One classroom may have taller students, while another may have shorter students. The averages may vary at first. However, when you keep taking more samples and calculate their averages, those averages begin to follow a balanced and predictable shape.
This is the core idea behind the Central Limit Theorem. Even if the original data is messy or uneven, the average values from many samples slowly become organized in a normal distribution. This pattern appears naturally when the sample size is large enough.
The theorem is useful because real-world data is rarely perfect. Businesses, hospitals, banks, and technology companies often deal with unpredictable information. The Central Limit Theorem helps professionals make reliable decisions from that uncertainty.
Why the Central Limit Theorem Matters
The reason this theorem is so valuable is that it allows analysts to make predictions using sample data instead of studying every single data point. In many situations, collecting complete data is expensive and time-consuming. Sampling makes the process more practical.
For example, election surveys usually collect opinions from a smaller group of people rather than the entire population. Product companies test customer feedback from selected users before launching a new feature. Financial analysts also depend on sampled data to study market behavior.
Because of the Central Limit Theorem, these samples can still produce meaningful insights when collected correctly. If you are interested in understanding how statistics supports business decisions and predictive analysis, you can explore a Data Science Course in Kolkata to strengthen your practical knowledge in analytics and machine learning.
A Simple Real Life Example
Think about rolling a dice. A single roll can produce any number between one and six, which feels random. Now imagine rolling the dice many times and calculating the average result for different groups of rolls.
At first, the averages may seem irregular. However, as the number of samples increases, the averages begin to gather around a central value. This balanced behavior is exactly what the Central Limit Theorem describes.
The theorem shows that randomness becomes more stable when observations increase. This is why companies trust statistical models for forecasting sales, customer behavior, and operational performance.
Connection With Data Science
In data science, professionals constantly work with data samples instead of complete populations. Machine learning models, business dashboards, and research studies all depend on statistical confidence. The Central Limit Theorem underpins that assurance.
Without this theorem, it would be difficult to estimate trends or measure accuracy in predictive systems. Data scientists use this concept while testing models, analyzing experiments, and interpreting user behavior.
The theorem also improves decision-making because it reduces uncertainty. Instead of depending on guesses, organizations can rely on patterns supported by statistical evidence.
The Central Limit Theorem may sound technical, but its basic principle is easy to understand. When enough samples are collected, the averages begin to follow a stable and predictable pattern. This simple idea powers many of the statistical methods used in modern analytics and data science.
Understanding this theorem helps beginners build confidence in statistics without feeling overwhelmed by equations. It also creates a strong foundation for advanced topics such as hypothesis testing, machine learning, and predictive analytics. If you are planning to develop industry-ready analytical skills, taking a Data Science Course in Delhi can help you apply these concepts through practical learning and real-world projects.
Also check: Making Sense of Accuracy Precision and Recall